fatiando.gravmag.interactive)¶Interactivity functions and classes using matplotlib and IPython widgets
Gravity forward modeling
Moulder: a matplitlib GUI for 2D
forward modeling using polygonsfatiando.gravmag.interactive.Moulder(area, x, z, data=None, density_range=[-2000, 2000], **kwargs)[source]¶Bases: object
Interactive 2D forward modeling using polygons.
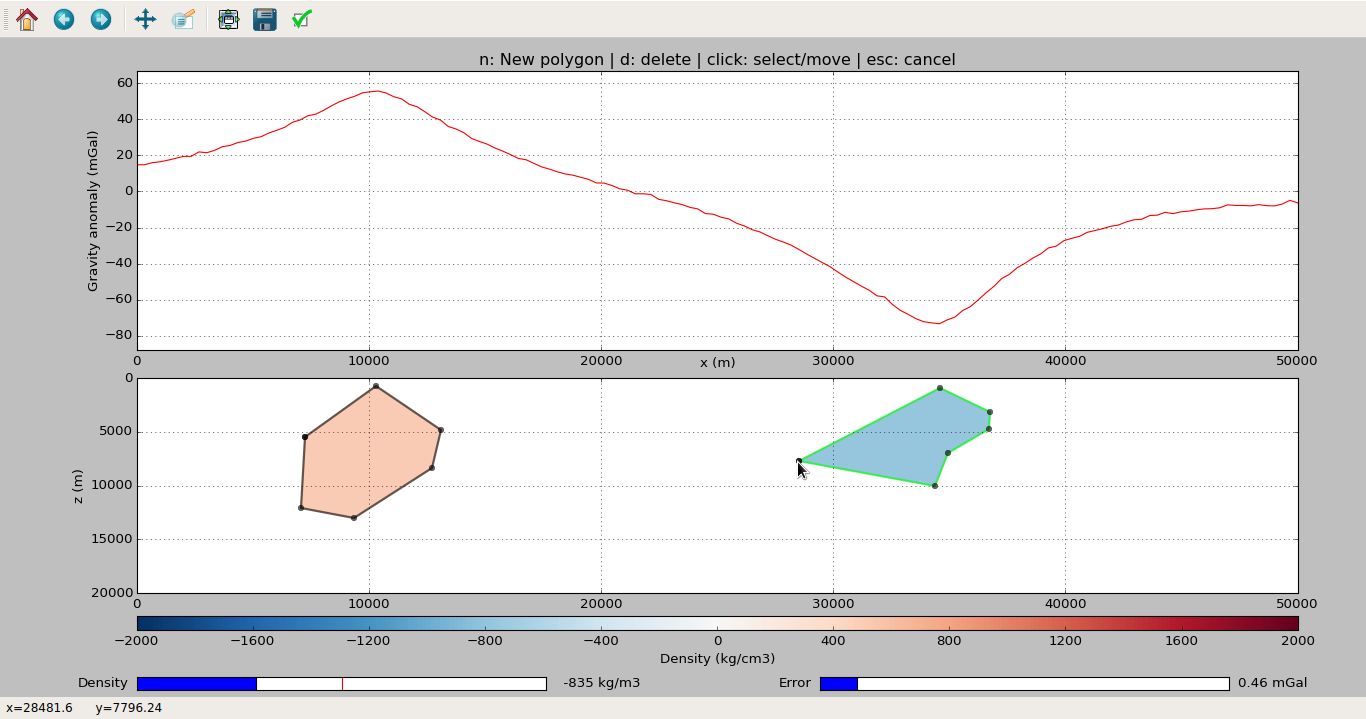
A matplotlib GUI application. Allows drawing and manipulating polygons and computes their predicted data automatically. Also permits contaminating the data with gaussian pseudo-random error for producing synthetic data sets.
Uses fatiando.gravmag.talwani for computations.
Moulder objects can be persisted to Python pickle files using the
save method and later
restored using load.
Warning
Cannot be used with %matplotlib inline on IPython notebooks because
the app uses the matplotlib plot window. You can still embed the
generated model and data figure on notebooks using the
plot method.
Parameters:
The limits of the model drawing area, in meters.
The x- and z-coordinates of the computation points (places where predicted data will be computed). In meters.
Observed data measured at x and z. Will plot this with black dots along the predicted data.
The minimum and maximum values allowed for the density. Determines the limits of the density slider of the application. In kg.m^-3. Defaults to [-2000, 2000].
Other keyword arguments used to restore the state of the application.
Used by the load method.
Not intended for general use.
Examples:
Make the Moulder object and start the app:
import numpy as np
area = (0, 10e3, 0, 5e3)
# Calculate on 100 points
x = np.linspace(area[0], area[1], 100)
z = np.zeros_like(x)
app = Moulder(area, x, z)
app.run()
# This will pop-up a window with the application (like the screenshot
# below). Start drawing (follow the instruction in the figure title).
# When satisfied, close the window to resume execution.

After closing the plot window, you can access the model and data from the Moulder object:
app.model  # The drawn model as fatiando.mesher.Polygon
app.predicted  # 1d-array with the data predicted by the model
# You can save the predicted data to use later
app.save_predicted('data.txt')
# You can also save the application and resume it later
app.save('application.pkl')
# Close this session/IPython notebook/etc.
# To resume drawing later:
app = Moulder.load('application.pkl')
app.run()
load(fname)[source]¶Restore an application from a pickle file.
The pickle file should have been generated by the
save method.
Parameters:
The name of the file.
Returns:
The restored application. You can continue using it as if nothing had happened.
model¶The polygon model drawn as fatiando.mesher.Polygon objects.
plot(figsize=(10, 8), dpi=70)[source]¶Make a plot of the data and model for embedding in IPython notebooks
Doesn’t require %matplotlib inline to embed the plot (as that would
not allow the app to run).
Parameters:
The figure size in inches.
The number of dots-per-inch for the figure resolution.
run()[source]¶Start the application for drawing.
Will pop-up a window with a place for drawing the model (below) and a place with the predicted (and, optionally, observed) data (top).
Follow the instruction on the figure title.
When done, close the window to resume program execution.
save(fname)[source]¶Save the application state into a pickle file.
Use this to persist the application. You can later reload the entire
object, with the drawn model and data, using the
load method.
Parameters:
The name of the file to save the application. The extension doesn’t
matter (use .pkl if in doubt).