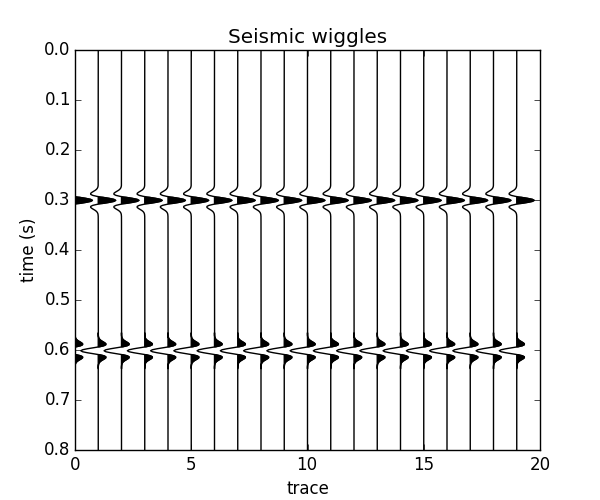
One way to plot seismic data is using black and white wiggles.
Function fatiando.vis.mpl.seismic_wiggle does exactly this.
import numpy as np
import matplotlib.pyplot as plt
from fatiando.seismic import conv
from fatiando.vis.mpl import seismic_wiggle

# We need some data to plot, so let's generate some using the convolution model
# in fatiando.seismic.conv
n_samples, n_traces = 400, 20
dt = 2e-3    # the sampling interval
velocity = 1500*np.ones((n_samples, n_traces))
# Our model will have a different velocity layer in the middle. This will cause
# a reflection on the top and one on the bottom (with reversed polarity).
velocity[150:300, :] = 2500
# For simplicity, we'll assume constant density when calculating the
# reflectivity.
rc = conv.reflectivity(velocity, 2000*np.ones_like(velocity))
data = conv.convolutional_model(rc, f=30, wavelet=conv.rickerwave, dt=dt)

# Plot the data using wiggles
plt.figure(figsize=(6, 5))
plt.title("Seismic wiggles")
# The scale parameter makes the wiggles larger or smaller
seismic_wiggle(data, dt=dt, scale=3, color='k')
plt.ylabel('time (s)')
plt.xlabel('trace')
plt.show()
Total running time of the script: ( 0 minutes 0.085 seconds)