You can create the (x, y, z) coordinate arrays for regular grids using
fatiando.gridder.regular.
Out:
x = [     0.      0.      0.      0.      0.      0.      0.      0.      0.
   2500.   2500.   2500.   2500.   2500.   2500.   2500.   2500.   2500.
   5000.   5000.   5000.   5000.   5000.   5000.   5000.   5000.   5000.
   7500.   7500.   7500.   7500.   7500.   7500.   7500.   7500.   7500.
  10000.  10000.  10000.  10000.  10000.  10000.  10000.  10000.  10000.]
y = [-5000. -3750. -2500. -1250.     0.  1250.  2500.  3750.  5000. -5000.
 -3750. -2500. -1250.     0.  1250.  2500.  3750.  5000. -5000. -3750.
 -2500. -1250.     0.  1250.  2500.  3750.  5000. -5000. -3750. -2500.
 -1250.     0.  1250.  2500.  3750.  5000. -5000. -3750. -2500. -1250.
     0.  1250.  2500.  3750.  5000.]
z = [-150. -150. -150. -150. -150. -150. -150. -150. -150. -150. -150. -150.
 -150. -150. -150. -150. -150. -150. -150. -150. -150. -150. -150. -150.
 -150. -150. -150. -150. -150. -150. -150. -150. -150. -150. -150. -150.
 -150. -150. -150. -150. -150. -150. -150. -150. -150.]
from __future__ import print_function
from fatiando import gridder
import matplotlib.pyplot as plt
# Define the area of the grid in meters: [x1, x2, y1, y2]
area = [0, 10e3, -5e3, 5e3]
# The shape is the number of points in the grid: (nx, ny)
shape = (5, 9)
x, y = gridder.regular(area, shape)
# x and y are 1d arrays with the coordinates of each point in the grid
print('x =', x)
print('y =', y)
# Optionally, you can generate a 3rd array with constant z values
# (remember that z is positive downward)
x, y, z = gridder.regular(area, shape, z=-150)
print('z =', z)
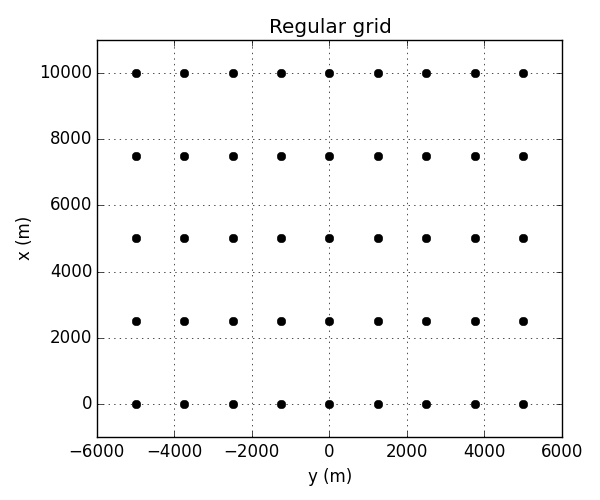
plt.figure(figsize=(6, 5))
plt.title('Regular grid')
# In Fatiando, x is North and y is East.
# So we should plot x in the vertical axis and y in horizontal.
plt.plot(y, x, 'ok')
plt.xlabel('y (m)')
plt.ylabel('x (m)')
plt.xlim(-6e3, 6e3)
plt.ylim(-1e3, 11e3)
plt.grid(True)
plt.tight_layout()
plt.show()
Total running time of the script: ( 0 minutes 0.072 seconds)