You can create the (x, y, z) coordinate arrays for a random scatter of points
using fatiando.gridder.scatter.
Out:
x = [ 3745.40118847  9507.1430641   7319.93941811  5986.58484197  1560.18640442
  1559.94520336   580.83612168  8661.76145775  6011.15011743  7080.72577796
   205.84494296  9699.09852162  8324.426408    2123.39110678  1818.24967207
  1834.04509853  3042.4224296   5247.56431632  4319.45018642  2912.29140198
  6118.52894722  1394.93860652  2921.44648535  3663.61843294  4560.69984217
  7851.75961393  1996.73782158  5142.34438414  5924.14568862   464.5041272
  6075.44851901  1705.24123687   650.51592985  9488.85537253  9656.32033075
  8083.97348116  3046.13769173   976.72114006  6842.33026512  4401.5249374
  1220.38234845  4951.76910111   343.88521115  9093.20402079  2587.799816
  6625.22284354  3117.11076089  5200.68021178  5467.10279343  1848.54455526
  9695.84627765  7751.32823361  9394.98941564  8948.27350428  5978.99978811
  9218.74235023   884.92502052  1959.82862419   452.27288911  3253.30330763
  3886.77289689  2713.49031774  8287.37509152  3567.53326694  2809.34509687
  5426.96083158  1409.24224975  8021.96980754   745.5064368   9868.86936601
  7722.44769297  1987.15681534    55.22117124  8154.61428455  7068.57343848
  7290.07168041  7712.70346686   740.44651734  3584.65728544  1158.69059525
  8631.03425876  6232.98126828  3308.98024853   635.58350286  3109.82321716
  3251.83322027  7296.06178338  6375.57471355  8872.12742576  4722.14925162
  1195.94245938  7132.44787223  7607.85048617  5612.77197569  7709.67179955
  4937.95596364  5227.32829382  4275.41018359   254.19126744  1078.91426993]
y = [-4685.70814313  1364.10411264 -1856.44018924    85.70691165  4075.66473926
 -2507.07770851  -896.17076964  2555.51138543 -2712.01834508 -4230.20090171
 -2102.48547086 -3387.78712746  4296.97652343  3081.20379564  1334.0375651
  3714.60590188  3036.72076899 -3134.29941114  3925.5899849    393.42241916
  3074.40155164  3960.91299923 -1819.96525028 -3899.48075472 -2720.64837458
  -728.92211374  3180.14765922  3607.30583256 -4930.47869469   107.47302578
  -825.88996851 -2778.92189529 -3801.34632666 -1623.84828596  4429.09703913
 -1767.97067979   187.90621743  2030.18958895 -1363.70397621  4717.82082721
  4624.47294942 -2482.17704175   -27.51494108 -1991.21690183 -2151.59505623
 -4631.13052645  1095.6433398     26.79023229 -4485.2124875  -2213.53535763
  4082.65885967 -2604.38109333 -3551.05127909  -105.47239722  4856.50454111
 -2579.44728488  1721.35547406  2616.19615329 -2623.62456008  2282.16348612
 -1322.16867281  1323.05830594  1335.29710761   357.74684075 -4097.10229946
  3353.02495589 -1792.19935028 -3134.814896   -4592.24858445   908.92943188
  1775.64361842 -4834.12171072   120.93058299 -2735.04224802  1451.72790409
 -3256.33570995  1909.37738102 -1132.64653699  4367.29988737 -3624.79055854
 -1589.3364895  -3865.26478759  4246.93618279  3773.39353381 -2420.58372285
  1599.84046034  3172.22200201   552.00811599   296.50578356 -2581.477091
 -4068.97232194  3972.15757953  4004.18057163  1331.01457273 -1609.70208951
 -1507.90425387  2259.5567887   3971.10259953  3870.86424265  2798.75545858]
z = [-150. -150. -150. -150. -150. -150. -150. -150. -150. -150. -150. -150.
 -150. -150. -150. -150. -150. -150. -150. -150. -150. -150. -150. -150.
 -150. -150. -150. -150. -150. -150. -150. -150. -150. -150. -150. -150.
 -150. -150. -150. -150. -150. -150. -150. -150. -150. -150. -150. -150.
 -150. -150. -150. -150. -150. -150. -150. -150. -150. -150. -150. -150.
 -150. -150. -150. -150. -150. -150. -150. -150. -150. -150. -150. -150.
 -150. -150. -150. -150. -150. -150. -150. -150. -150. -150. -150. -150.
 -150. -150. -150. -150. -150. -150. -150. -150. -150. -150. -150. -150.
 -150. -150. -150. -150.]
from __future__ import print_function
from fatiando import gridder
import matplotlib.pyplot as plt
# Define the area where the points are generated in meters: [x1, x2, y1, y2]
area = [0, 10e3, -5e3, 5e3]
# The point scatter is generated from a uniform random distribution.
# So running the scatter function twice will produce different results.
# You can control this by passing a fixed seed value for the random number
# generator.
x, y = gridder.scatter(area, n=100, seed=42)
# x and y are 1d arrays with the coordinates of each point
print('x =', x)
print('y =', y)
# Optionally, you can generate a 3rd array with constant z values
# (remember that z is positive downward).
x, y, z = gridder.scatter(area, n=100, z=-150, seed=42)
print('z =', z)
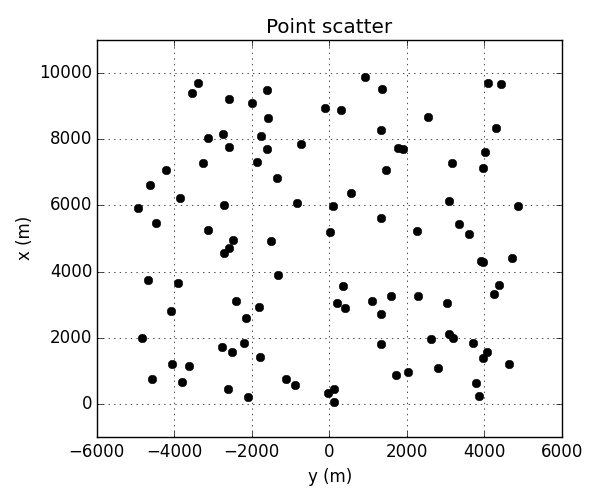
plt.figure(figsize=(6, 5))
plt.title('Point scatter')
# In Fatiando, x is North and y is East.
# So we should plot x in the vertical axis and y in horizontal.
plt.plot(y, x, 'ok')
plt.xlabel('y (m)')
plt.ylabel('x (m)')
plt.xlim(-6e3, 6e3)
plt.ylim(-1e3, 11e3)
plt.grid(True)
plt.tight_layout()
plt.show()
Total running time of the script: ( 0 minutes 0.075 seconds)